Day analysis
The day analysis represents the core of daily controlling within Nesto. For this purpose, three different views (sales per hour, cumulative sales, and staff requirements) are available. A detailed overview of the important key figures can be found here.
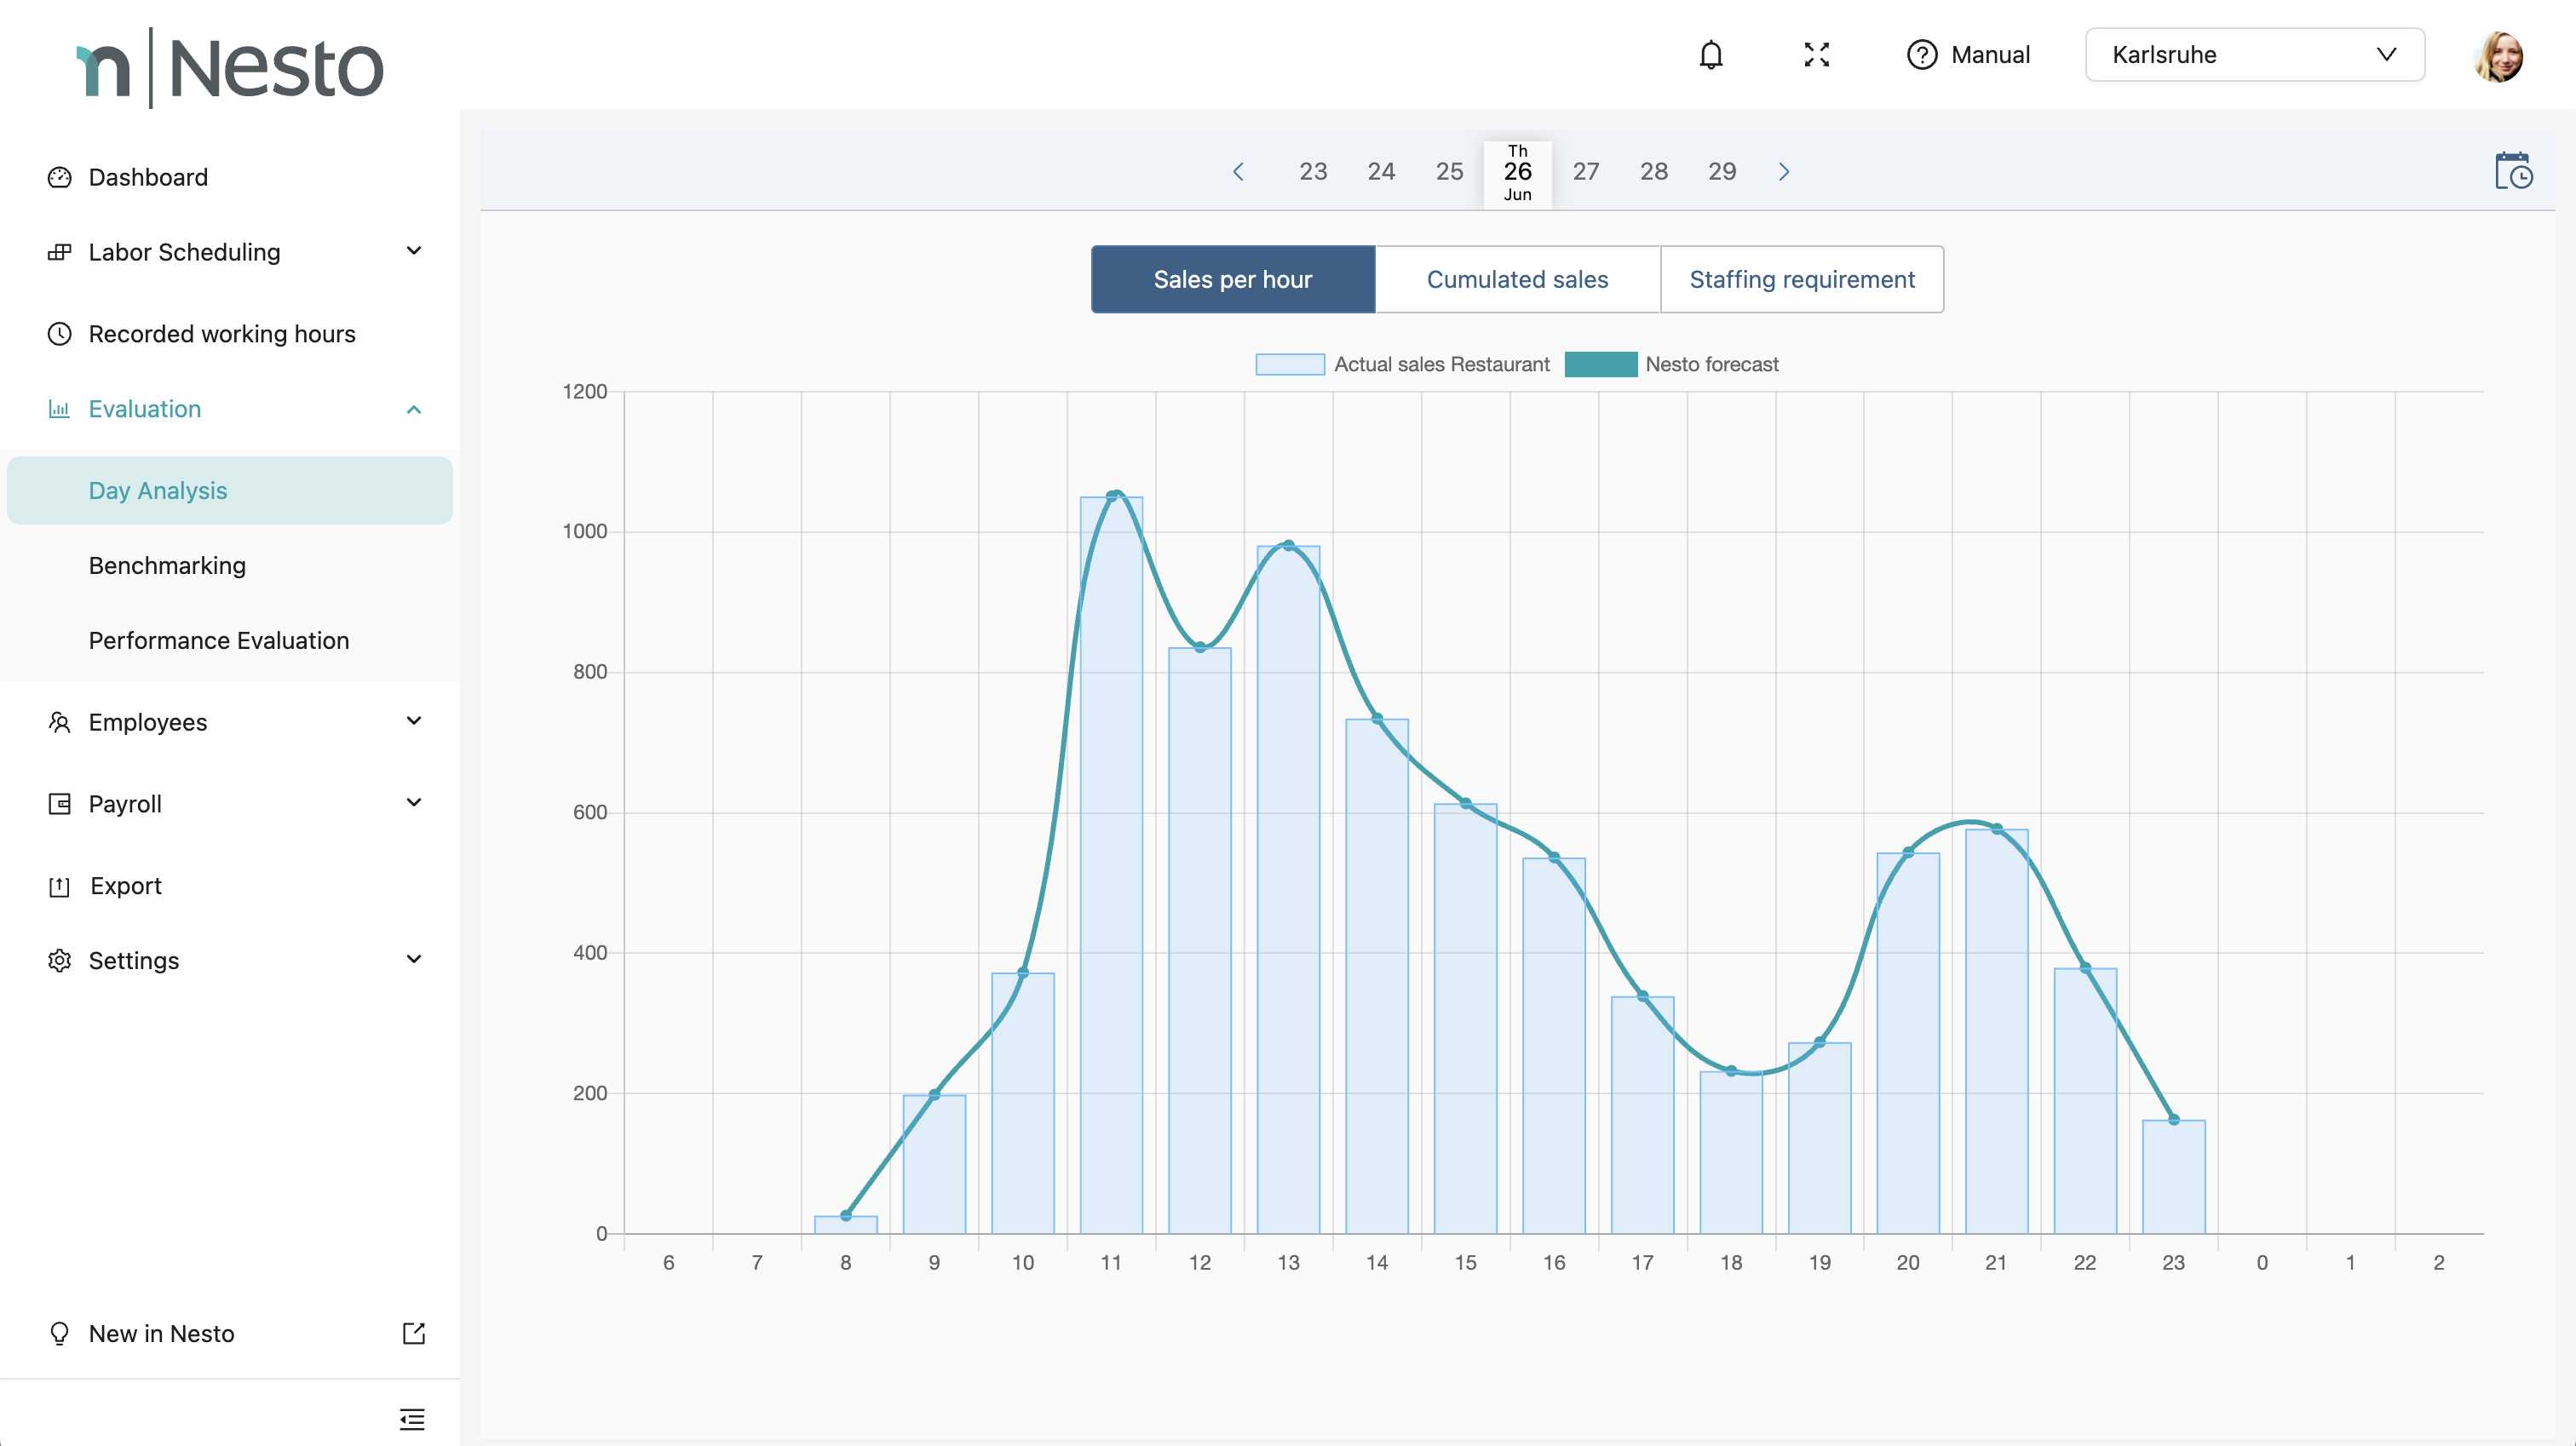
Sales per Hour
This chart shows the hourly Nesto forecast as a line and compares it with the actual hourly sales as columns. This enables an hour-precise review of the forecast quality. If the forecast was overwritten by a shift manager, this would be indicated by the words “adjusted forecast.”
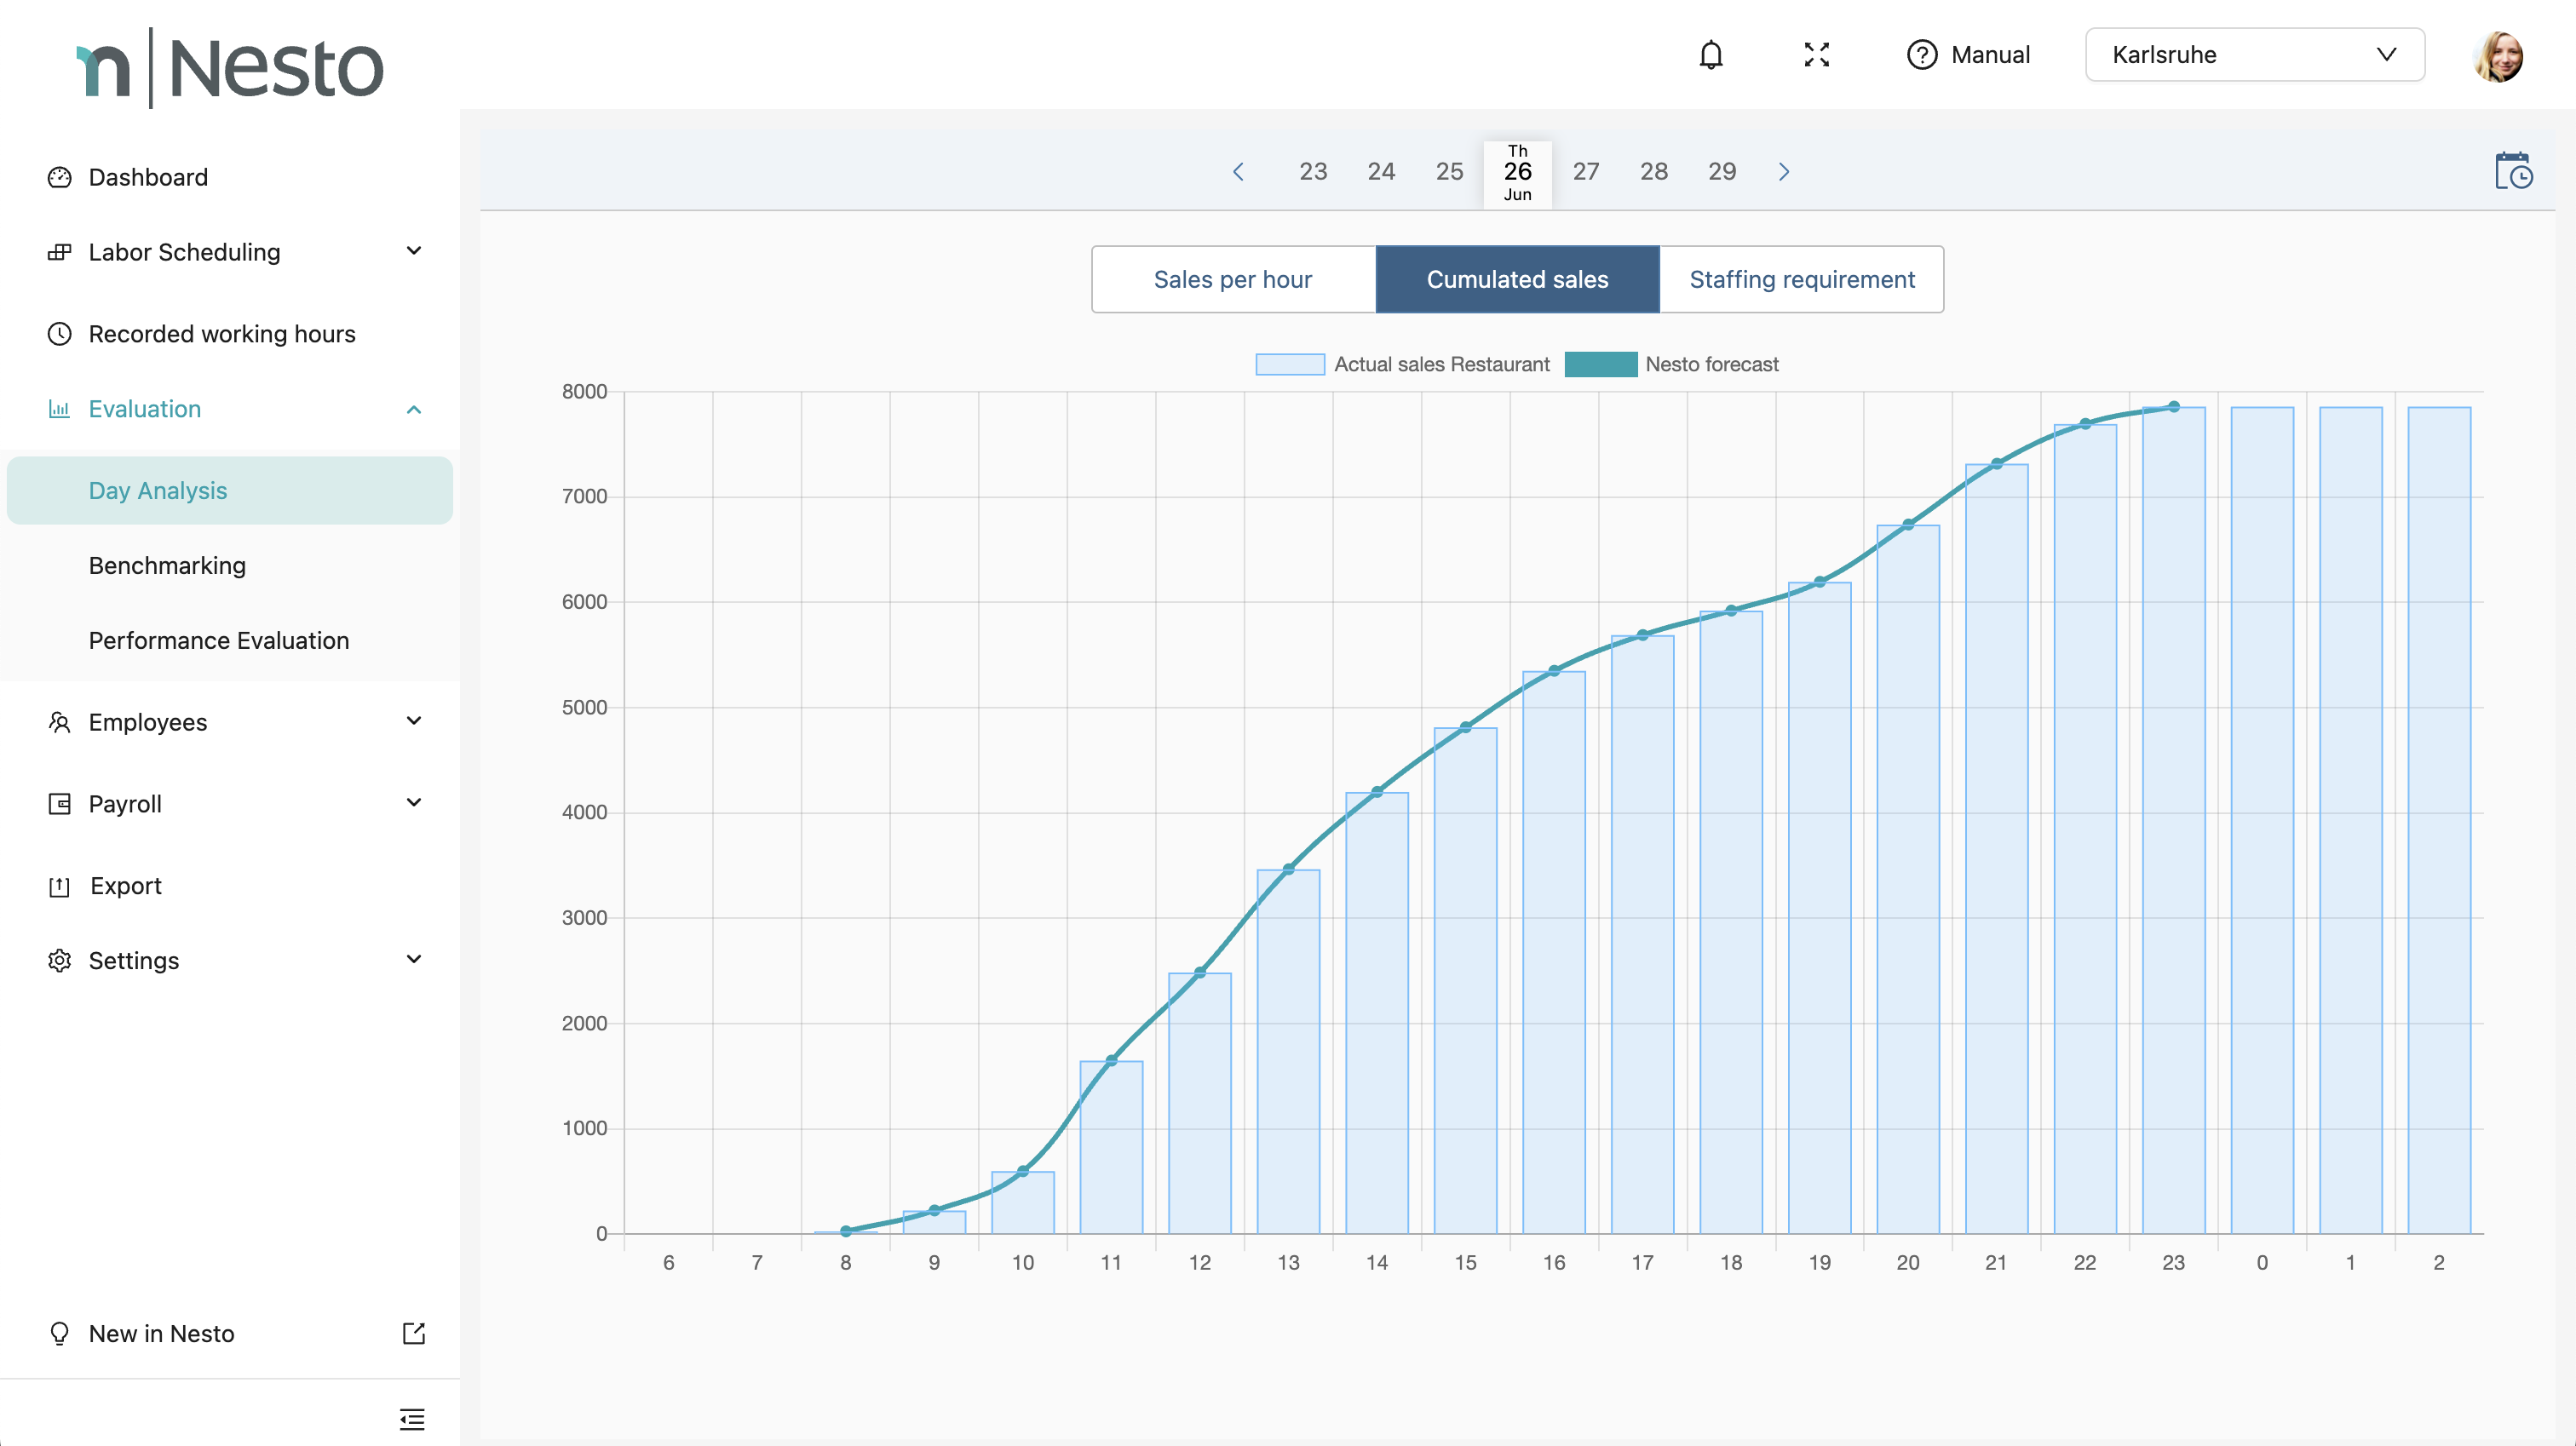
Cumulative Sales
The second view shows the cumulative forecasts and sales for the respective business day. This allows a review of the forecast quality on a daily basis and provides an initial overview of the sales trend throughout the day.
Staff Requirements
The third view converts sales via the MEO into corresponding personnel requirements and compares these with the planned or recorded working times. This enables a review of demand-oriented planning and work retrospectively for each individual day:
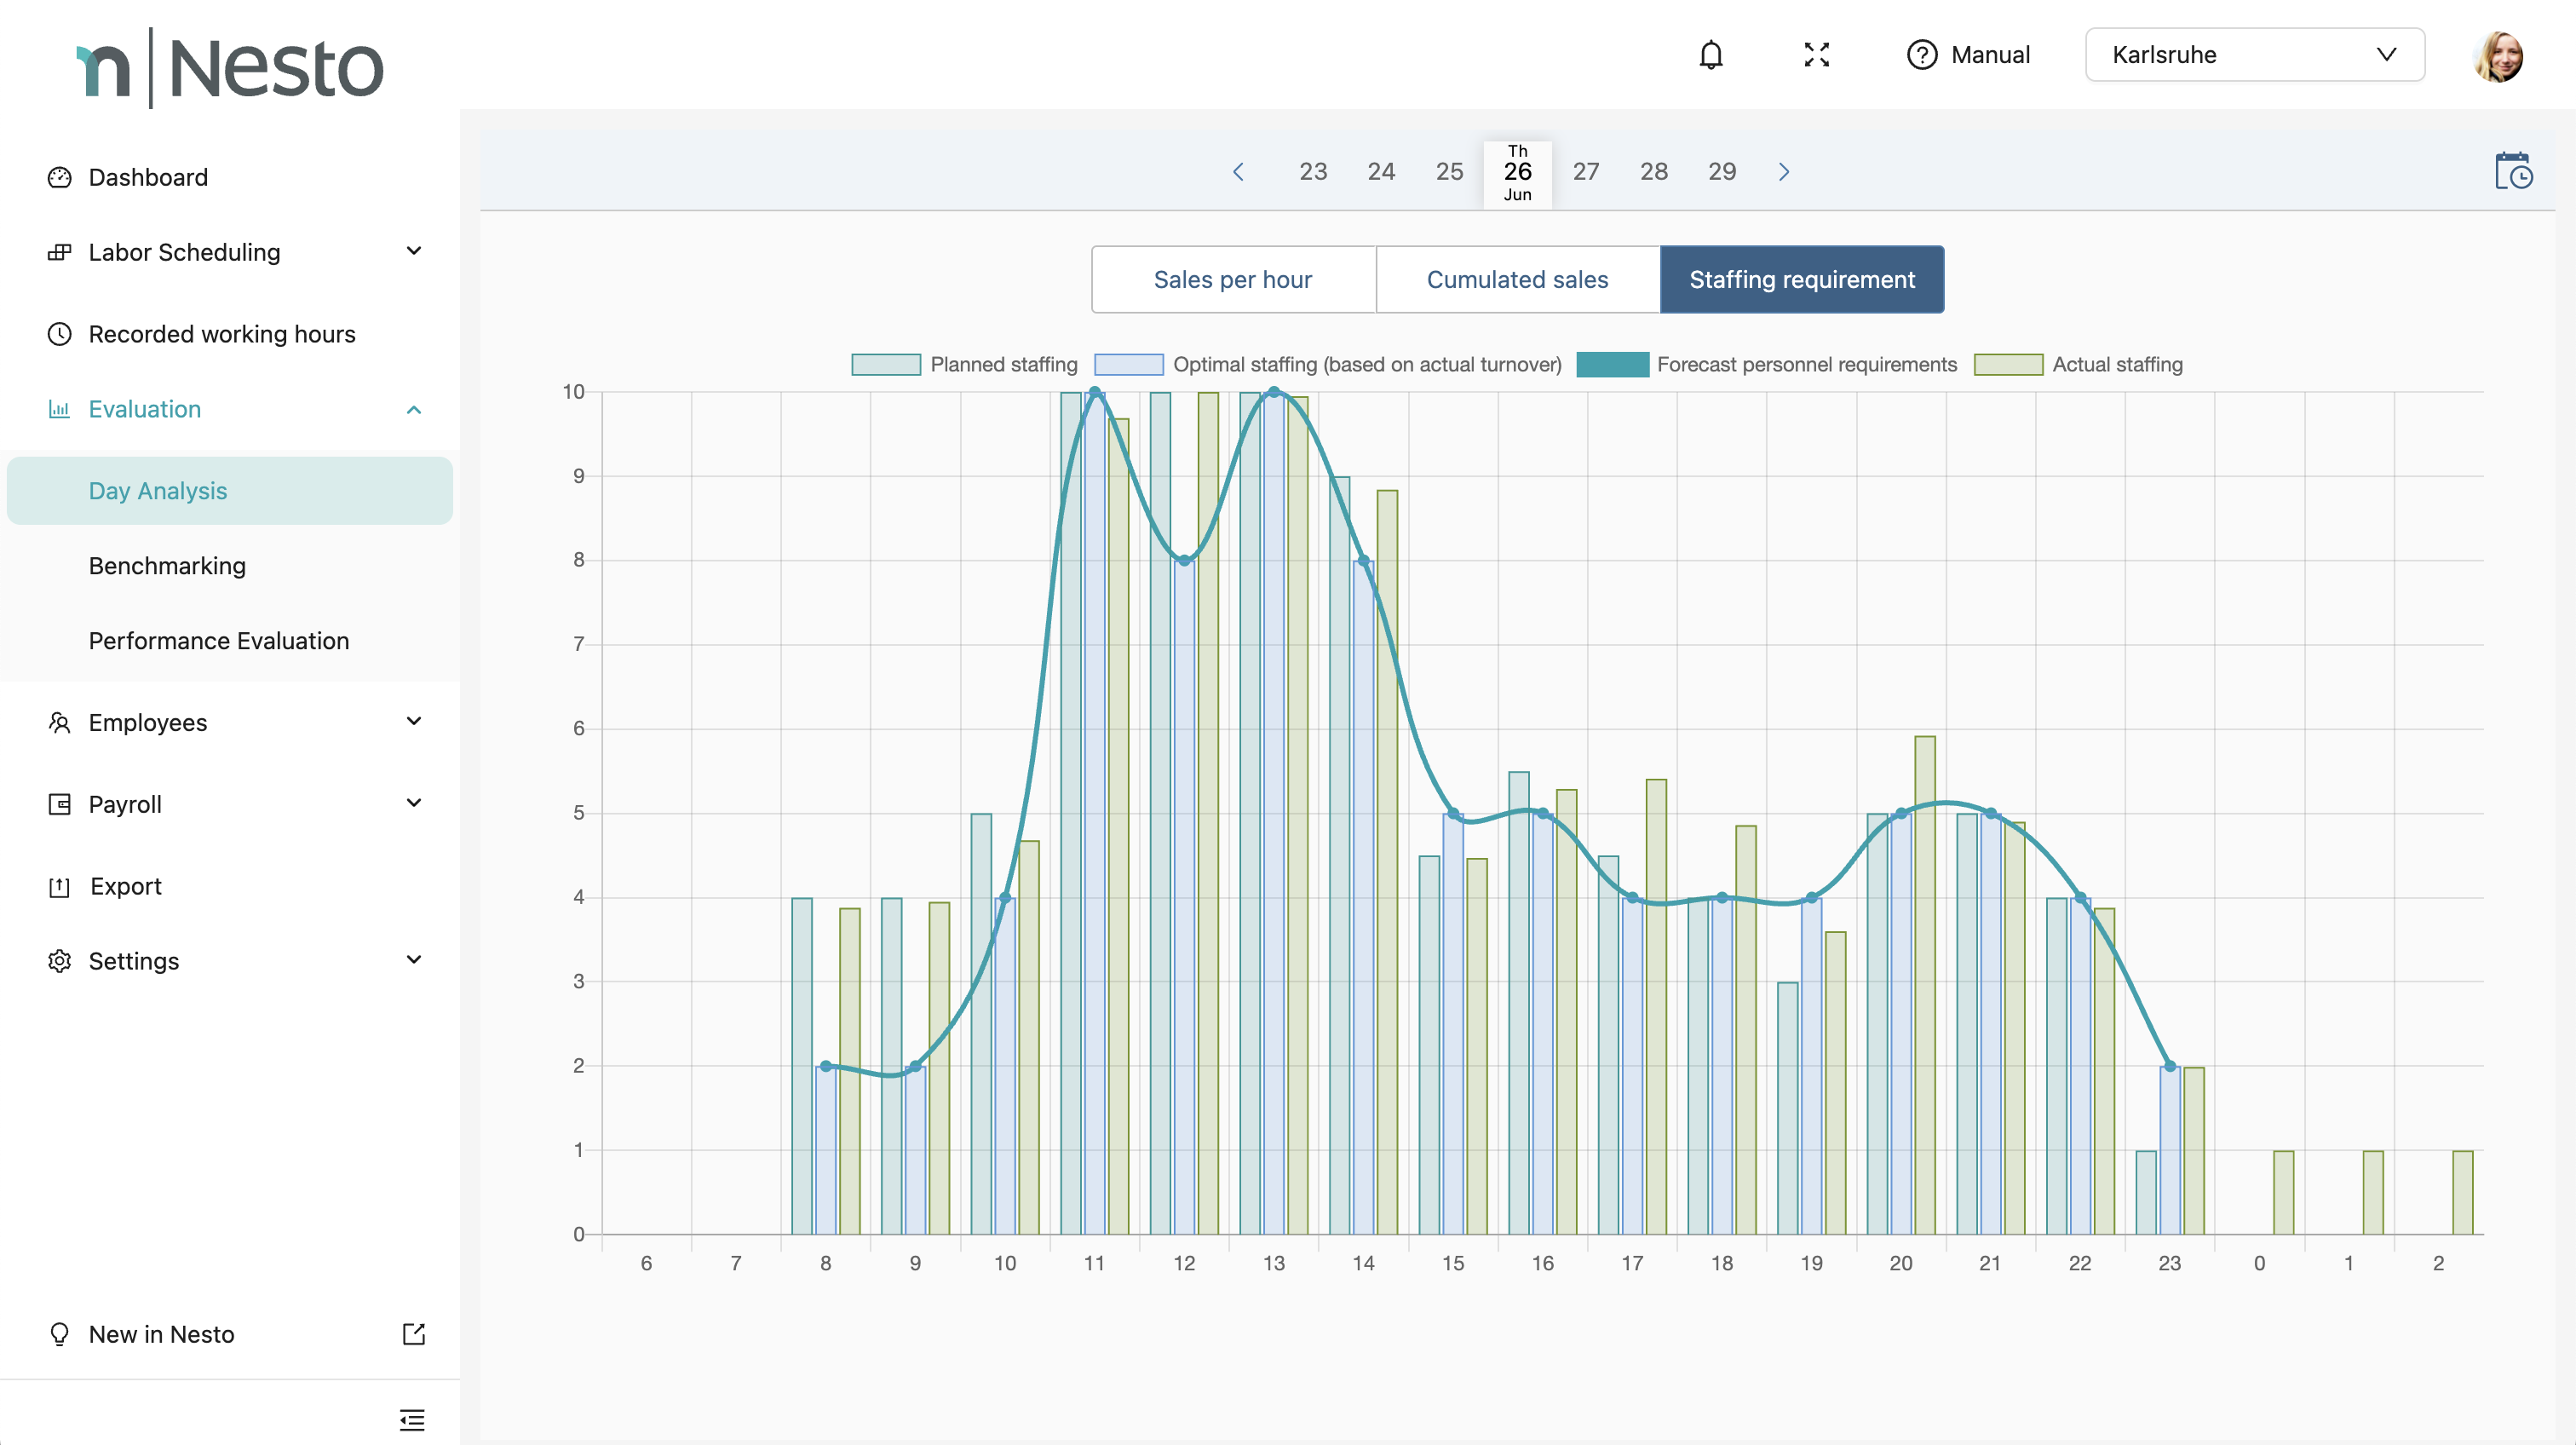
This view offers a variety of evaluation options that help quickly identify and resolve operational and planning challenges. We distinguish between four KPIs in this view, which in combination optimally support daily controlling:
Planned staffing: This is the number of employee hours per hour planned in the last approved shift proposal.
Optimal staffing (based on actual sales): This is the number of employee hours per hour that would have been optimal according to the MEO. For this, the actual hourly sales are converted with the MEO into personnel requirements per hour.
Forecasted staff requirement: This is the number of employee hours per hour proposed based on the sales forecast and the existing MEO.
Actual staffing: This is the number of clocked hours per hour.
To conduct daily controlling primarily, the comparison of these key figures is relevant. Different conclusions can be drawn depending on the comparison:
Comparison of forecasted staff requirement to planned staffing: If these values are very similar, it means that the staff was planned according to the forecasts provided by Nesto and thus followed demand-oriented planning.
Comparison of planned staffing to actual staffing: If these values are very similar, the shift leader was able to implement the shift proposal in practice.
Comparison of optimal staffing to forecasted staff requirement: If these values match, a very precise sales forecast by Nesto was present – both actual sales and sales forecast are converted through the MEO.
Comparison of optimal staffing, forecasted staff requirement, and planned staffing: If there is a deviation between the first two values and the planned staffing, two interpretations are possible. On the one hand, it is of course possible that the shift manager did not plan demand-oriented. However, if it can be assumed that the shift manager planned “intuitively” demand-oriented, a deviation of both optimal staffing and forecasted requirement from planned staffing indicates an incorrectly stored MEO. It may be important here to review the MEO and minimum staffing again carefully.